Human Resources
Percentage of women among employees and managers
As of April each year / Full-time employees
| 2021 | 2022 | 2023 | 2024 | 2025 | |||||||
|---|---|---|---|---|---|---|---|---|---|---|---|
| male | woman ratio (%) |
male | woman ratio (%) |
male | woman ratio (%) |
male | woman ratio (%) |
male | woman ratio (%) |
||
| woman | woman | woman | woman | woman | |||||||
| Benesse Corporation | Number of employees | 1,087 | 53 | 1,127 | 52 | 1,173 | 52 | 1,651 | 48 | 1,708 | 48 |
| 1,218 | 1,220 | 1,259 | 1,544 | 1,561 | |||||||
| (Internal: Section Chief level) | 149 | 35 | 157 | 35 | 143 | 38 | 185 | 36 | 172 | 39 | |
| 82 | 85 | 89 | 103 | 111 | |||||||
| (Internal: Department Head level) | 47 | 33 | 67 | 31 | 71 | 29 | 72 | 27 | 69 | 30 | |
| 23 | 30 | 29 | 27 | 29 | |||||||
| board member | 11 | 15 | 9 | 10 | 13 | 13 | 13 | 13 | 23 | 12 | |
| 2 | 1 | 2 | 2 | 3 | |||||||
Number of hires by gender (Benesse Corporation)
Fiscal year ending March each year
| 2022 | 2023 | 2024 | 2025 | 2026 * | ||
|---|---|---|---|---|---|---|
| New graduates | male | 29 | 35 | 52 | 61 | 67 |
| woman | 37 | 24 | 40 | 36 | 33 | |
| subtotal | 66 | 59 | 92 | 97 | 100 | |
| halfway Fiscal year ending March 2025 |
male | 68 | 104 | 105 | 96 | — |
| woman | 27 | 81 | 60 | 47 | — | |
| subtotal | 95 | 185 | 165 | 134 | — | |
| Total of new graduates and mid-career hires | 161 | 244 | 257 | 243 | — | |
Employment rate of people with disabilities (including Benesse Style Care Group)
As of June 1st of each year
| 2021 | 2022 | 2023 | 2024 | 2025 | |
|---|---|---|---|---|---|
| Employment rate for people with disabilities | 2.47% | 2.54% | 2.51% | 2.60% | 2.60% |
Number of employees starting childcare leave and number of employees returning to work
Fiscal year ending March each year
| 2021 | 2022 | 2023 | 2024 | 2025 | |||||
|---|---|---|---|---|---|---|---|---|---|
| Leave of absence Number of starters |
Return to work Number of people |
Leave of absence Number of starters |
Return to work Number of people |
Leave of absence Number of starters |
Return to work Number of people |
Leave of absence Number of starters |
Return to work Number of people |
Leave of absence Number of starters |
|
| Benesse Corporation (Regular employees, specialized employees, contract employees) |
52 | 59 | 76 | 85 | 80 | 84 | 123 | 92 | 112 |
Rate of men taking childcare leave, etc.
Fiscal year ending March (%)
| 2021 | 2022 | 2023 | 2024 | 2025 | |
|---|---|---|---|---|---|
| Benesse Corporation (Regular employees, specialized employees, contract employees) |
49 | 51 | 51 | 66 | 73 |
Number of people taking reduced working hours for childcare
As of April of each year
| 2021 | 2022 | 2023 | 2024 | 2025 | |
|---|---|---|---|---|---|
| Benesse Corporation (Regular employees, specialized employees, contract employees) |
50 | 53 | 58 | 41 | 59 |
Work-life management related data (Benesse Corporation)
March each year / Full-time employees
| 2021 | 2022 | 2023 | 2024 | 2025 | ||
|---|---|---|---|---|---|---|
| Overtime hours (average/month) * | 38.2 hours | 39.6 hours | 38.9 hours | 41.0 hours | 39.5 hours | |
| Paid leave utilization rate (average/annual) | 52% | 54% | 60% | 60% | 61% | |
| Number of employees taking caregiving leave | 1 person | 2 people | 1 person | 3 people | 4 people | |
| Average length of service | male | 12.2 years | 13.1 years | 12.6 years | 10.1 years | 9.6 years |
| woman | 13.0 years | 14.3 years | 13.8 years | 12.2 years | 12.5 years | |
Gender wage gap (the ratio of women's wages to men's wages)
March period (%)
| 2023 | 2024 | 2025 | |||||||
|---|---|---|---|---|---|---|---|---|---|
| Regular employment | Part-time/Fixed-term | All workers | Regular employment | Part-time/Fixed-term | All workers | Regular employment | Part-time/Fixed-term | All workers | |
| Benesse Corporation (Regular employees, specialized employees, contract employees) |
85 | 88 | 71 | 88 | 91 | 77 | 86 | 91 | 76 |
Employee engagement (including Benesse Style Care Group)
Engagement Rating Evaluation
Fiscal year ending March each year
| 2022 |
2023
|
2024
|
|||
|---|---|---|---|---|---|
| June | november | June | november | ||
| Engagement Rating | A | BBB | BBB | A | BBB |
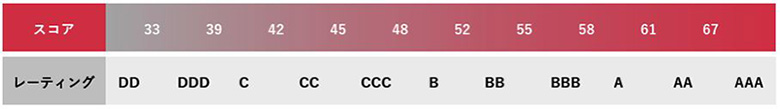
Engagement Rating:
The evaluation scale for the engagement between a company and its employees (degree of mutual understanding and affection) ranges from AAA to DD, with 11 levels.
Employee training expense record (Benesse Corporation)
Fiscal year ending March each year
|
2021
|
2022
|
2023
|
2024
|
2025
|
|
|---|---|---|---|---|---|
| Total amount (million yen) | 131 | 132 | 176 | 219 | 285 |
| Cost per person (yen) | — | 91,411 | 76,905 | 84,401 | 81,500 |
| Time per person (hours) | — | 21.9 | 25.5 | 23.3 | 19.6 |
environment
Scope 1, 2, and Scope 3 reduction targets
<Benesse Corporation>
Fiscal year ending March each year
| Every year * | 2030 * | 2041 | 2050 * | |
|---|---|---|---|---|
| Scope 1 and 2 reduction rates based on 2018 | 4.4% | 52.8% | 100% | 100% |
Reduction targets are SBTi certified
[Revision date: September 29, 2022]
Fiscal year ending March each year
| Every year | 2030 | 2050 | |
|---|---|---|---|
| Scope 3 reduction rate with 2018 as the base year | 1.23% | 14.8% | 39.4% |
- The above reduction targets apply to Scope 1, Scope 2, and Scope 3.
- Scope 1: Benesse's own direct greenhouse gas emissions
Scope 2: Indirect emissions from the use of electricity, heat, and steam supplied by others.
Scope 3: Emissions from Benesse's Value Chain
- Scope 3 target categories:
- Category 1 (Purchased Products and Services), 2 (Capital Goods), 3 (Fuel and Energy-Related Activities *Not included in Scope 1 and 2), 4 and 9 (Transportation and Distribution Upstream and Downstream), 5 (Business Waste), 6 (Business Travel), 7 (Employee Commuting), 8 (Leased Assets), 11 (Use of Sold Products), 12 (Disposal of Sold Products)
- Target organization scope:
- Benesse Corporation's domestic and Taipei branches
Scope 1, 2, and Scope 3 reduction results
<Benesse Corporation>
[Scope 1, 2, and 3 Reduction Results]
Fiscal year ending March each year
| Unit: t-CO2 | Base year performance | Achievements | Achievements |
|---|---|---|---|
| 2018 | 2024 | 2025 | |
| Scope 1 | 120 | 294 | 410 |
| Scope 2 | 7,477 | 4,327 | 4,306 |
| Scope 3 | 220,450 | 149,400 | 138,695 |
| Scope 1, 2, 3 total | 228,047 | 154,021 | 143,411 |
| YoY comparison | 93.68% | 93.11% |
[CO2 emissions by scope]
Fiscal year ending March each year
| Unit: t-CO2 | 2023 | 2024 | 2025 | ||
|---|---|---|---|---|---|
| Scope 1 | 73 | 294 | 410 | ||
| Scope 2 | 2,989 | 4,327 | 4,306 | ||
| Scope 3 | 161,356 | 149,400 | 138,695 | ||
| 1 | Purchased products and services | 136,531 | 127,079 | 116,291 | |
| 2 | capital goods | 4,457 | 4,806 | 5,230 | |
| 3 | Fuel and energy activities not included in Scope 1 and 2 | 800 | 918 | 990 | |
| 4 | Transportation and delivery (upstream) | 2,755 | 1,494 | 1,296 | |
| 5 | Waste generated from business operations | 515 | 553 | 500 | |
| 6 | business trip | 2,671 | 3,377 | 3,481 | |
| 7 | Employees' commute | 1,278 | 1,416 | 1,543 | |
| 8 | Leased assets (upstream) | 0 | 0 | 0 | |
| 9 | Transportation and delivery (downstream) | 6,763 | 4,757 | 5,139 | |
| 10 | Processing of sold products | 0 | 0 | 0 | |
| 11 | Use of the products sold | 304 | 279 | 188 | |
| 12 | Disposal of sold products | 5,282 | 4,721 | 4,037 | |
| 13 | Leased assets (downstream) | 0 | 0 | 0 | |
| 14 | franchise | 0 | 0 | 0 | |
| 15 | investment | 0 | 0 | 0 | |
| Scope 1, 2, 3 total | 164,418 | 154,021 | 143,411 | ||
Energy consumption, water consumption, waste generation
<Benesse Corporation>
Fiscal year ending March each year
| unit | 2023 | 2024 | 2025 | |
|---|---|---|---|---|
| electric power | MWh | 7,624 | 7,579 | 9,069 |
| heat | 1,000 GJ | 9 | 10 | 10 |
| city gas | thousand m³ | 26 | 29 | 36 |
| A heavy oil | ℓ | 78 | 66 | 36 |
| gasoline | ℓ | 5,444 | 101,843 | 124,614 |
| diesel fuel | ℓ | - | - | 19,043 |
| Water usage | thousand m³ | 31 | 28 | 28 |
| Waste (paper) output | t | 1,196 | 1,475 | 1,180 |
| Waste (industrial waste) discharge | t | 475 | 623 | 486 |
Last updated: April 1, 2026